Running the Salesman Performance report
The Salesman Performance report generates details for each salesperson and the totals of all the salespeople at your agency regarding your clients. This report includes:
- The number of active clients, the number of active client with no placements in the last 180 days, and the percentage of slow inventory.
- The number of new clients, the number of new clients with placements for the month-to-date (MTD), and the percentage of active clients that are new.
- Average commission sales and collection amounts for the last three and last six months.
- For each salesperson, a list of the top 10 clients based on MTD referred amount, MTD commission, and year-to-date (YTD) commission.
To run the Salesman Performance report:
-
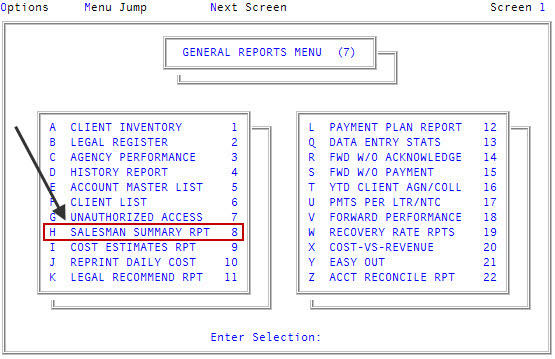
From the Master menu, navigate to General Reports > Salesman Summary Rpt (menu 7.8).
- If The Collector System is in a preliminary Month-End process, the Preliminary Month End in Progress. Use Old or New Month? prompt displays. Do one of the following:
- To run the report from information in the old month, click Old.
- To run the report from information in the new month, click New.
- To return to the General Reports menu, click Cancel.
- In the Salesman Report window, select Salesman Performance Report, and press Enter or click Ok.
- At the Select your output destination prompt, do one of the following:
To view or print the report, click View.
The Collector System generates the report in a Notepad document. You can then print the file or save it to your workstation or network.
- To email the report, click Email.
- To save the report as a file, click File.
- At the Enter Windows folder path prompt, type the path to the location on your workstation or network to store the file, and press Enter. For example, to store the file on your C drive, type C:\My Documents\Libraries\SalesPerfReport.txt, or to store the file to a network location, type /home/joe.user/SalesPerfReport.txt.
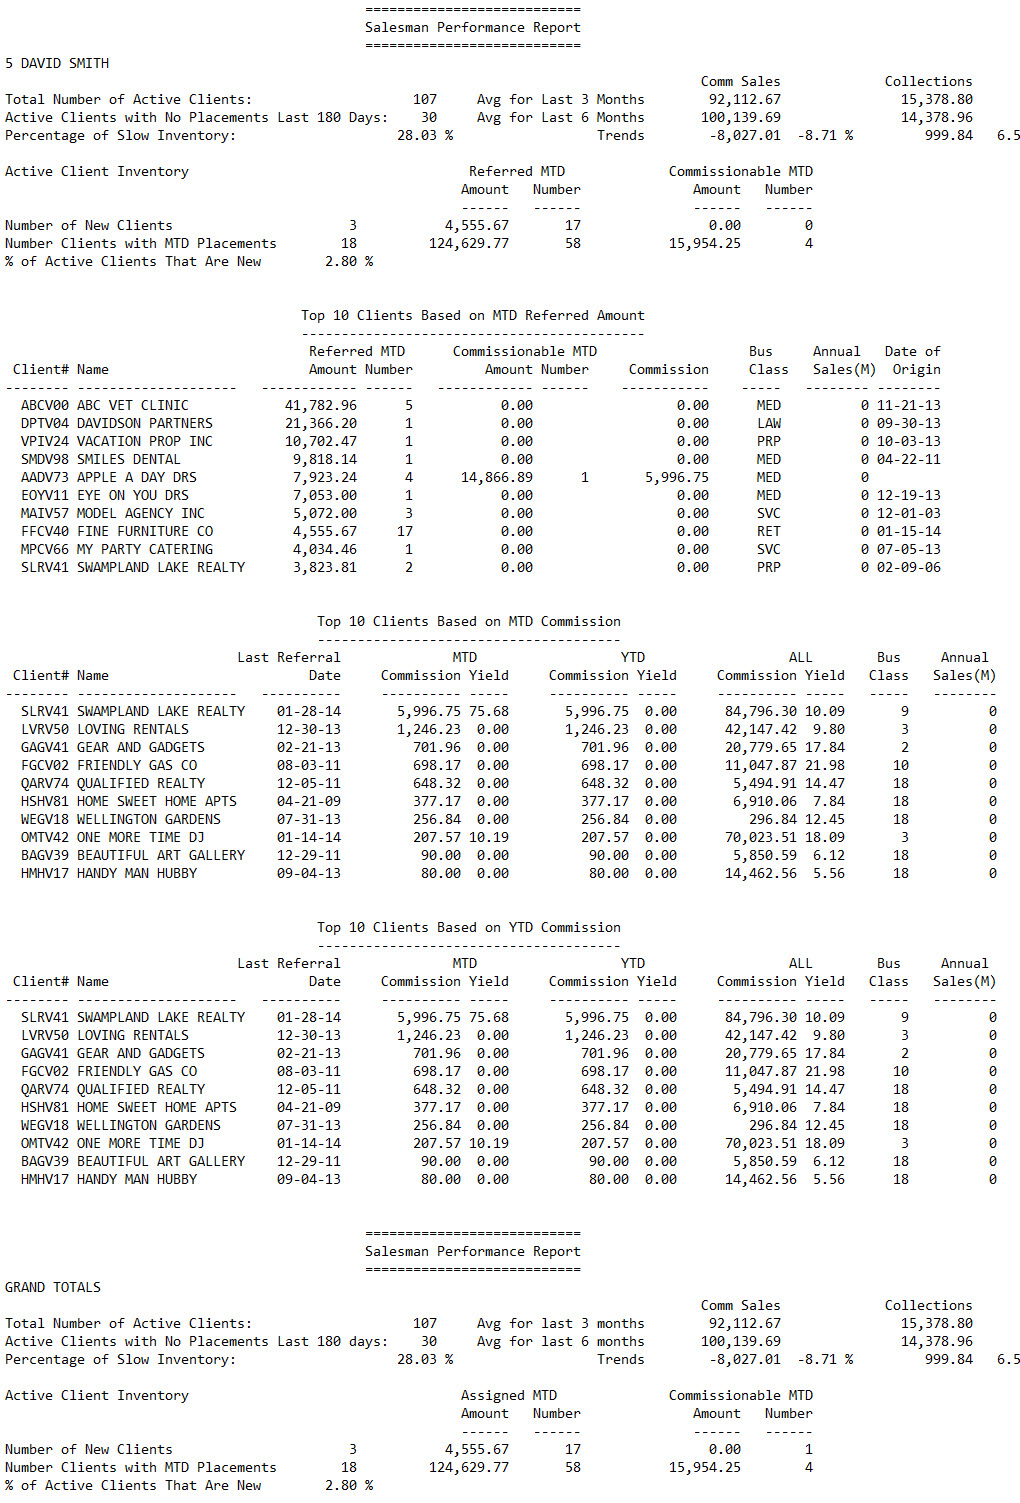
The following is an example of the Salesman Performance report:
The following table describes the fields in the Salesman Performance report:
|
Column |
Description |
|
Total Number of Active Clients |
The total number of active clients brought in by the salesperson. |
|
Active Clients with No Placements Last 180 Days |
The number of salesperson's clients that have not placed new accounts in the last 180 days. |
|
Percentage of Slow Inventory |
The percentage of the salesperson's clients considered slow due to the lack of new placements. This number is calculated by dividing the number of active clients with no placements in the last 180 days by the total number of active clients. |
|
Avg for Last 3 Months |
The average amount of commissions earned and the amount collected for the salesperson's clients for the last three months. |
|
Avg for Last 6 Months |
The average amount of commissions earned and the amount collected for the salesperson's clients for the last six months. |
|
Trends |
The difference between the average commissions earned and the amount collected for the salesperson's clients between the last three and six months. |
|
Number of New Clients |
The number of new clients brought in by the salesperson. |
|
Number of Clients with MTD Placements |
The number of clients brought in by the salesperson that placed new accounts with the agency for the month-to-date. |
|
% of Active Clients That Are New |
The percentage of clients brought in by the salesperson that are new. |
|
Top 10 Clients Based on MTD Referred Amount |
|
|
Client# |
The number your agency uses to identify the client. |
|
Name |
The client's name. |
|
Referred MTD Amount |
The amount placed with the agency by the salesperson's client for the month-to-date. |
|
Referred MTD Number |
The number of accounts placed with the agency by the salesperson's client for the month-to-date. |
|
Commissionable MTD Amount |
The amount collected by the agency for the salesperson's client for the month-to-date. |
|
Commissionable MTD Number |
The number of accounts collected by the agency for the salesperson's client for the month-to-date. |
|
Commission |
The commission amount earned by the agency from the salesperson's client. |
|
Bus Class |
The business class assigned to the client. |
|
Annual Sales (M) |
The amount of business brought in by the salesperson's client for the last year. |
|
Date of Origin |
The date the salesperson's client began placing accounts with the agency. |
|
Top 10 Clients Based on MTD Commission |
|
|
Client# |
The number assigned by your agency to identify the client. |
|
Name |
The client's name. |
|
Last Assigned Date |
The last date accounts were placed with the agency for the salesperson's client. |
|
MTD Commission |
The commission amount earned by the agency from the salesperson's client for the month-to-date. |
|
MTD Yield |
The amount made by the agency from the salesperson's client for the month-to-date. |
|
YTD Commission |
The commission amount earned by the agency from the salesperson's client for the year-to-date. |
|
YTD Yield |
The amount made by the agency from the salesperson's client for the year-to-date. |
|
All Commission |
The total commission amount earned by the agency from the salesperson's client. |
|
All Yield |
The total amount made by the agency from the salesperson's client. |
|
Top 10 Clients Based on YTD Commission |
|
|
Client# |
The number your agency uses to identify the client. |
|
Name |
The client's name. |
|
Last Assigned Date |
The last date accounts were placed with the agency for the salesperson's client. |
|
MTD Commission |
The commission amount earned by the agency from the salesperson's client for the month-to-date. |
|
MTD Yield |
The amount made by the agency from the salesperson's client for the month-to-date. |
|
YTD Commission |
The commission amount earned by the agency from the salesperson's client for the year-to-date. |
|
YTD Yield |
The amount made by the agency from the salesperson's client for the year-to-date. |
|
All Commission |
The total commission amount earned by the agency from the salesperson's client. |
|
All Yield |
The total amount made by the agency from the salesperson's client. |
|
Grand Totals |
|
|
Total Number of Active Clients |
The total number of active clients brought in by all of the salespeople listed in the report. |
|
Active Clients with No Placements in the Last 180 days |
The number of salespeople's clients that have not placed new accounts in the last 180 days. |
|
Percentage of Slow Inventory |
The percentage of the salespeople's clients considered slow due to the lack of new placements. This number is calculated by dividing the number of active clients with no placements in the last 180 days by the total number of active clients. |
|
Avg for Last 3 Months |
The average number of commission sales and the amount collected for the salespeople's clients for the last three months. |
|
Avg for Last 6 Months |
The average number of commission sales and the amount collected for the salespeople's clients for the last six months. |
|
Trends |
The difference between the average commissions earned and the amount collected for the salespeople's clients between the last three and six months. |
|
Number of New Clients |
The number of new clients brought in by the salespeople. |
|
Number Clients with MTD Placements |
The number of salespeople's clients that placed new accounts for the month-to-date. |
|
% of Active Clients That Are New |
The percentage of clients brought in by the salespeople that are new. |