Running the History report with combined totals by state
Use this option to group clients by state. You can run this report for specific states or for all states.
To run the History report with combined totals by state:
-
From the Master menu, navigate to General Reports > History report(menu 7.4).
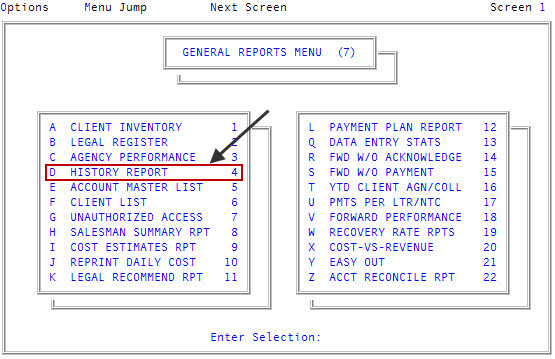
- In the History Report to Run window, select one of the following, and press Enter or click Ok:
- To print the Regular History report, select Regular History Only.
- To print the Stair Step History report, select Stair Step History Only.
- To print the Regular and Stair Step History reports, select Both Reports.
- To print the MTD Regular History report, select MTD Regular History Only.
- To print the MTD Stair Step History report, select MTD Stair Step History Only.
- To print both the MTD Regular and MTD Stair Step History reports, select MTD Both Reports.
- In the History Report Options window, select Combine Totals By State, and press Enter or click Ok.
- In the Enter State(s) Separated by a Semicolon window, do one of the following:
- Type the states of the clients to include in the History report, separating each with a semicolon, and press Enter or click Ok.
- To include all clients, type ALL, and press Enter or click Ok.
- To use a Get-List or Select statement, type the statement, and press Enter or click Ok. For more information, see Working with Recall.
- At the Select your output destination prompt, select one of the following:
- To view the report on the screen, select View.
- To email the report, select Email.
- To print the report, select Print.
- In the Select Printer to Use window, select the printer, and press Enter or click Ok.
- At the OK to print? prompt, click Yes.
- To return to the History Report window, select Cancel.
The following are examples of the Regular and Stair Step History reports. There are a variety of criteria by which you can run the report and additional options for sorting. Regardless of the options you select, the report contains the same information, just sorted in a different order.
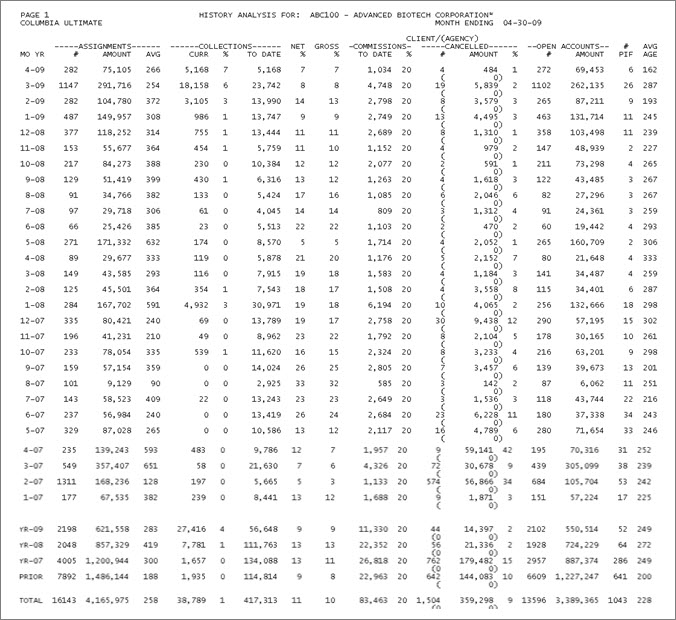
The following table describes the fields of the Regular History report:
|
Field |
Description |
|
Mo Yr |
The month and year the accounts were assigned. The last 12 months of assignments are reported along with totals for the last three years. The "Prior" period contains any figures prior to the last three years. |
|
Net/(Gross) Assignments |
|
|
# |
The total number of assignments in the period. |
|
Amount |
The period's assigned amount with adjustments. The unadjusted assigned amount for the period is shown in parentheses. |
|
Avg |
The average amount of each assignment. This is derived by dividing the amount assigned by the number of assignments. (Amount Assigned/# of Assignments = Avg) |
|
Collections |
|
|
Curr |
The dollar amount collected from accounts assigned in the month listed in the Mo Yr column of the same row, since the last time the History report was run. To reach this figure all trans codes which post payments to the assigned amount distribution received fields are added together, less any NSF amounts. |
|
% |
The percentage of current collections. This is computed by dividing current collections by the amount assigned. |
|
To Date |
Assigned amount collected to date on accounts assigned in the period. |
|
Net % |
The net percentage of collections. This is obtained by dividing the assigned amount collected to date by the amount assigned less the amount canceled for the period. |
|
Gross % |
The gross percentage of collections. This is obtained by dividing the assigned amount collected to date by the amount assigned for the period. |
|
Commissions |
|
|
To Date |
Amount of commissions the agency has claimed on collections to date. |
|
#PIF |
The number of accounts assigned in the period that have been paid in full. |
|
Avg Age |
The average age of the accounts assigned during the period. (The age is the difference between the assignment date and the client's last charge/last pay date). This is calculated during Month-End by adding the ages of all accounts that had a last charge/last pay date when they were entered or loaded, and dividing that by the total number assigned in the month. (Accounts that did not have a last charge/last pay date when they were entered or loaded have an effective age of zero). |
The following is an example of the Stair Step History report:
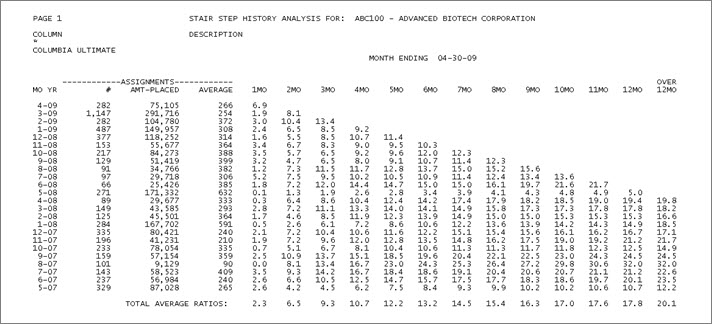
The following table describes the fields of the report:
|
Field |
Description |
|
Mo Yr |
The month and year of each period reported. |
|
Assignments |
|
|
# |
The total number of assignments in the period. |
|
Amt-Placed |
The unadjusted assigned amount placed during the period. |
|
Adjust |
The total of any adjustments made to the assigned amount. |
|
Net-Placed |
The period's assigned amount with adjustments. |
|
Average |
The average amount per assignment, net of adjustments. Each of the 1 Mo through 12 Mo columns shows the percentage of each period's assignments collected since they were assigned. For each column, the amount collected since assignment (the period shown in the Mo Yr column) is divided by the period's assigned amount with adjustments (the Net-Placed column) to give the percentage of the net assignments that was collected up to that time. The columns, going from left to right, are cumulative. The percentage in the 2 Mo column equals the percentage in the 1 Mo column plus the percentage collected in the following month. Generally the percentages increase; however, if there are many adjustments to the assigned amounts, the percentages can decrease yet still be correct. |
|
Total Average Ratios |
The average of each column. |